
The 4 Home Equity Markets Every Community Lender Should Understand
Explore four home equity market types and learn how borrower quality, market potential, and competition should shape your lending strategy.

.png)
Home equity lending isn't one market — it's fifty different ones, each shaped by its own mix of homeowner equity, borrower quality, and competitive pressure.
A strategy built for a state like New Hampshire, where equity runs deep and community lenders still hold the relationship advantage, won't work the same way in a state like Texas, where the opportunity is just as real but far more crowded. Treat every market the same, and you'll either overinvest where the payoff is limited or underinvest where the payoff is significant.
For community banks and credit unions, that's not a small problem. You're competing against national banks with bigger marketing budgets and non-bank lenders built for digital speed, all while trying to serve a borrower base that looks different in every market you operate in. A one-size-fits-all home equity program leaves growth on the table in some states and burns budget chasing borrowers who don't exist in others.
Years of rising home values have also left homeowners across the country with more tappable equity than they've had in a long time, and more of them are starting to think about using it. That's a real opportunity for community lenders, but only if the strategy behind it is built around the market you're actually in, not a national average.
So we pulled apart the data behind Coviance's State of Home Equity model and found four distinct market types, and each one calls for a different growth strategy.
Here's how to figure out which one you're in. →
Meet the Home Equity Opportunity Matrix
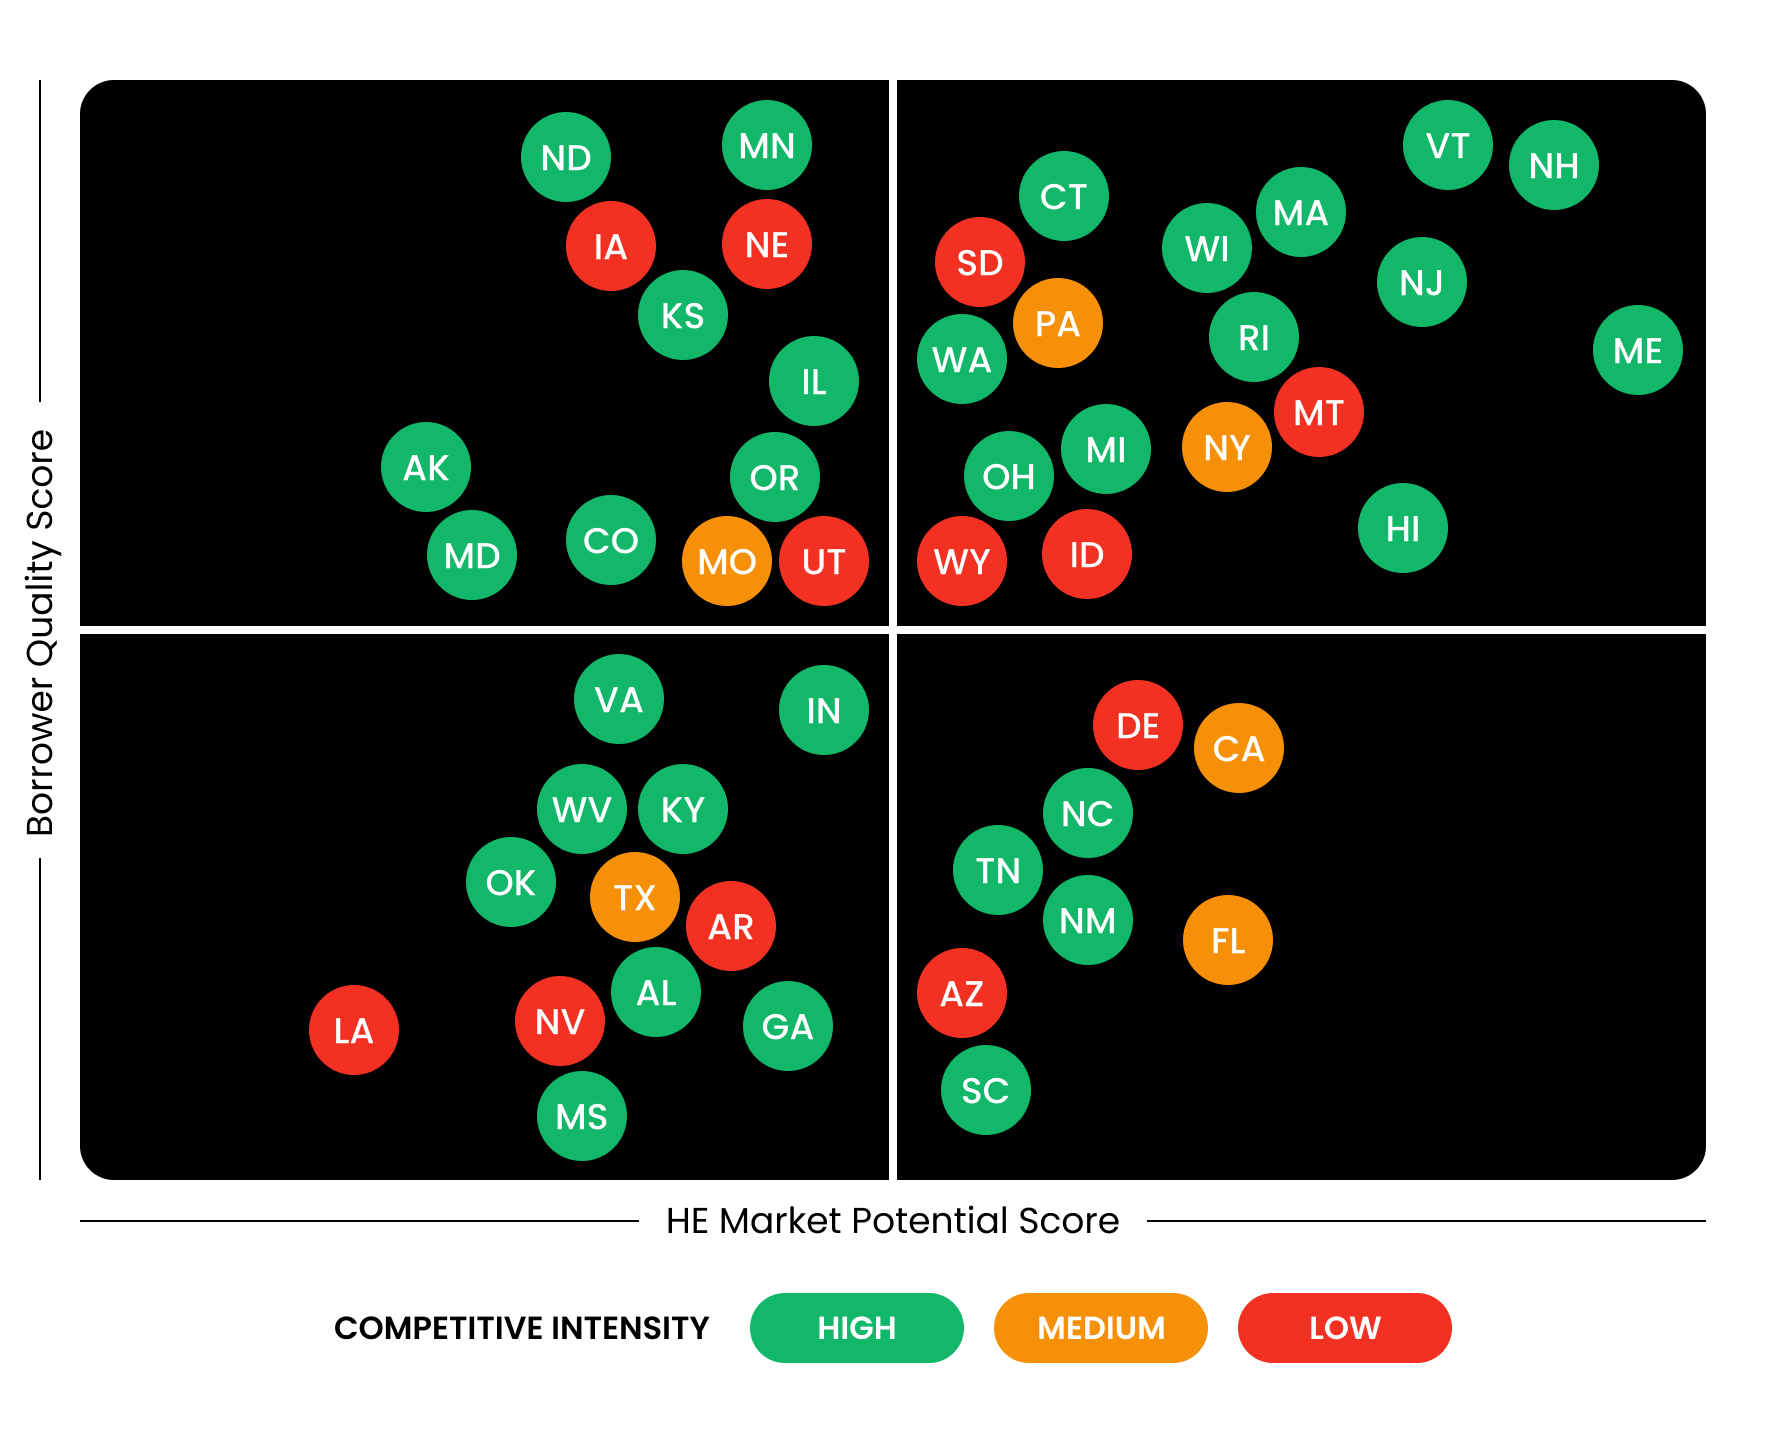
This framework scores every state on two main factors:
- Borrower Quality is about the homeowners themselves: credit scores, income relative to debt, how often people fall behind on payments. It tells you how qualification-ready the borrower base actually is.
- Market Potential is about the equity sitting there to tap: how much of it exists, how fast it's grown, how many owner-occupied homes are behind it. A state can have great borrowers and still have a small addressable opportunity if home values haven't moved much. The reverse happens too.
Cross those two factors and four market types fall out: Prime Markets, Quiet Strength Markets, High Stakes Markets, and Focused Opportunity Markets.
The third factor sits on top: Competitive Intensity, and it works a little differently. It doesn't tell you how much opportunity exists in a market, but rather how hard you'll have to compete for it.
The Four Market Types
Most states land somewhere in between, but four groups sit closest to the extremes, and they make the pattern easy to see.
1. The Prime Markets: high quality, high potential
New Hampshire is the cleanest example, alongside Vermont and New Jersey. Homeowner income runs above the national figure, the average equity cushion sits north of 55% of home value, and non-bank lenders have only picked up a small slice of home equity activity, well under what they've captured nationally.
- Common characteristics: high credit quality, strong income relative to debt, meaningful equity cushions, and a competitive landscape where community lenders have a favorable window.
- Recommended strategic focus: Own the Relationship — most borrowers here likely highly qualified, so the question is not "can I get approved?", but if they're even thinking about home equity of if your institution is the one they think of first. That usually comes down to how well you're mining the relationships you already have rather than how much you're spending to find new ones.
2. The Quiet Strength Markets: high quality, low potential
Iowa, Minnesota, and Nebraska fall here. Minnesota actually posts the highest borrower quality score of any state in the model, with low debt, strong credit, and low delinquency. But home values in these states haven't appreciated the way they have on the coasts, so the equity dollars per household are smaller.
- Common characteristics: high credit scores, low delinquency, modest debt loads, but comparatively limited equity dollars and slower home price appreciation.
- Recommended strategic focus: Stay and Improve — there isn't enough raw dollar volume here to justify a big acquisition push, so the better play is deepening the relationships you already have, cross-selling into a borrower base you already trust, and sizing products for smaller, more incremental borrowing needs instead of chasing scale that isn't there.
3. The High Stakes Markets: lower quality, higher potential
California and Florida are the headline states, with Arizona close behind. California's average homeowner equity is the highest in the country, and Florida generates tens of millions of home equity touchpoints every year. On paper, that's the biggest opportunity in the whole dataset.
Look closer at the borrower side, though, and it gets more complicated. Debt-to-income ratios and delinquency rates in both states run above the national average, and in Florida especially, non-bank lenders have already claimed a big share of the market's attention. Arizona lands in a similar spot on borrower quality and equity but faces noticeably less competitive heat.
- Common characteristics: large tappable equity pools and high overall market activity, paired with weaker debt and credit fundamentals than the equity numbers alone would suggest.
- Recommended strategic focus: Win on Speed, Lighten the Load — the opportunity is real, but so is the friction. These markets reward lenders who can qualify and process efficiently, cut unnecessary manual steps, and move fast enough to keep up with the digital-first lenders already active there.
4. The Focused Opportunity Markets: lower quality, lower potential
Texas, Louisiana, and Nevada land here. Equity pools are on the mid-to-smaller size, and borrower fundamentals run softer than the national average on both debt load and delinquency.
It's tempting to write these markets off, but that's the wrong read. Smaller opportunity isn't the same as no opportunity, it just means the borrowers worth pursuing are a smaller, more specific slice of the population, and finding them takes more precision than a broad campaign will give you.
- Common characteristics: below-average equity depth, weaker borrower financial fundamentals, and a wide range of competitive conditions from state to state.
- Recommended strategic focus: Know Your Borrower, Right-Size the Opportunity — you already know your customer base well, so your approach should be to use property data, deposit history, and existing account relationships to identify households that are actually positioned to qualify, instead of using a one-size-fits-all marketing approach.
Competitive Intensity Determines How You Compete
Here's where the third variable earns its place in the framework. Two states can land in the exact same quadrant on Borrower Quality and Market Potential and still require completely different playbooks, depending on how much competitive pressure is already in the market.
Texas and Louisiana make the point well. Both sit in the focused opportunity quadrant, but Texas alone generates more than 43 million home equity touchpoints a year, with over half of that already captured by non-bank lenders. Louisiana's total market activity is a fraction of that number. So a lender in Texas is fighting for visibility in a fast, crowded market, while a lender in Louisiana is dealing with a quieter market where the real constraint is finding enough qualified borrowers in the first place, not beating out competitors for each one.
The same split shows up in the high-stakes group: California and Florida both see heavy competitive pressure, with non-bank lenders capturing well above the national average share of touchpoints. Arizona sits in a similar spot on the other two factors but with meaningfully less competition behind it.
That's the practical takeaway: Competitive Intensity doesn't tell you whether the opportunity exists. It tells you how you need to go get it, and it touches nearly every part of the strategy:
- Speed to close. In high-intensity markets, a slow timeline costs you borrowers no matter how good your rate is. If a non-bank competitor can fund in days, weeks isn't competitive.
- Borrower experience. A smooth digital application matters more where borrowers are comparing multiple lenders at once. In quieter markets, a slower, more consultative process can still work in your favor.
- Automation. High-intensity markets make automation close to mandatory, it's how you compress your timeline without adding headcount. Low-intensity markets still benefit, just with less urgency behind it.
- Marketing and awareness. In low-intensity markets, community lenders often already have the relationship edge, so the job is reminding existing customers home equity is an option. In high-intensity markets, you're competing for a share of voice against lenders spending heavily to be top of mind the moment a homeowner starts searching.
- Operational efficiency. More competition tends to bring more volume, and more volume exposes every manual bottleneck in your process. Lower-intensity markets give you a bit more room to absorb inefficiency, though it's never a reason to ignore it.
Two states can look nearly identical on paper, in equity depth, in borrower income, in credit quality, and still call for very different execution once you factor in how hard the competition is already pushing.
Know Your Market, Then Build Around It
None of these four market types is inherently better than the others. Every market carries opportunity — what differs is the type of opportunity, the borrower behind it, and the strategy most likely to actually convert it into funded loans.
The states above are just a handful of examples pulled from the extremes to make the framework easy to see. Most markets land somewhere in between, with their own particular mix of borrower strength, equity depth, and competitive pressure, which is exactly what should be shaping your strategy instead of a generic national playbook.
That's the whole idea behind the State of Home Equity report. We broke down all 50 states, not just the those above, so you can see exactly where your market sits and what strategy actually fits it.
.png)